

Is Live Chat Slowing Down Your Website?
by Rajiv SinghaWe tested 10 popular live chat apps and their impact on page load speed.
Live chats are awesome! They can help increase your conversions and help turn window shoppers into customers. More than one study suggests consumers prefer live chat over a phone call. We have witnessed business owners choosing hosting providers only if they have 24/7 live chat support.
But there’s also a less studied aspect of adding live chats to your website that has a negative impact on a site – its impact on page load speed.
We decided to study how 10 popular live chat apps impact the core web vitals and other site speed metrics.
List of Live chat tools tested
Here are the tools we tested in no particular order:
- Tawk To
- Zoho
- Liveagent
- Livechat
- Drift
- Hubspot
- Froged
- Kayako
- Zendesk
- Olark
The installations of the scripts were done assuming the user has a beginner’s level of familiarity with WordPress. We also tried testing Intercom and FreshDesk but the process of integrating them was more complicated and hence we couldn’t include them in our list. We had a hard time with Freshdesk especially as they have a plethora of tools now under a single umbrella but it isn’t clear how to set up Fresh Chat.
The Process
- We compiled a list of 10 popular live chat apps(above).
- Next, we set up a WordPress site and imported a starter site theme.
- We tested the site without any live chat scripts and noted the numbers.
- We installed the live chat apps one by one at a time and ran the speed tests. Each previous live chat app was deleted before installing a new one.
- There were 11 pages created in total on the site. We ran 3 tests for desktop and 3 for mobile each.
- Finally, we averaged data across each of 6 tests by desktop and mobile.
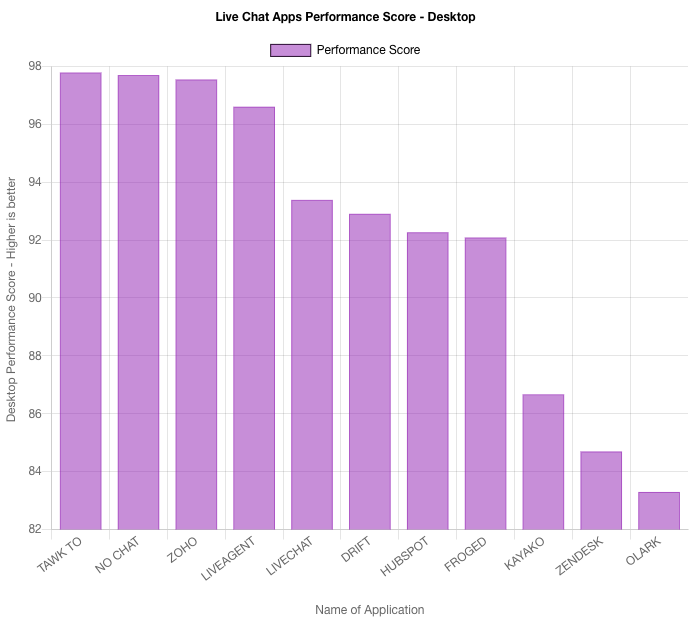
Which live chat app had the highest performance numbers on Desktop
From what we found, Tawk.to comes out on top among the apps we tested as the fastest live chat app on the desktop. Surprisingly, Tawk.to’s desktop performance score was even marginally better than with no chat scripts installed.
Turns out it was out of 3 tests on the desktop for a URL the score was 92, 92, 93. The two fluctuations of 92 caused a slight change in performance.
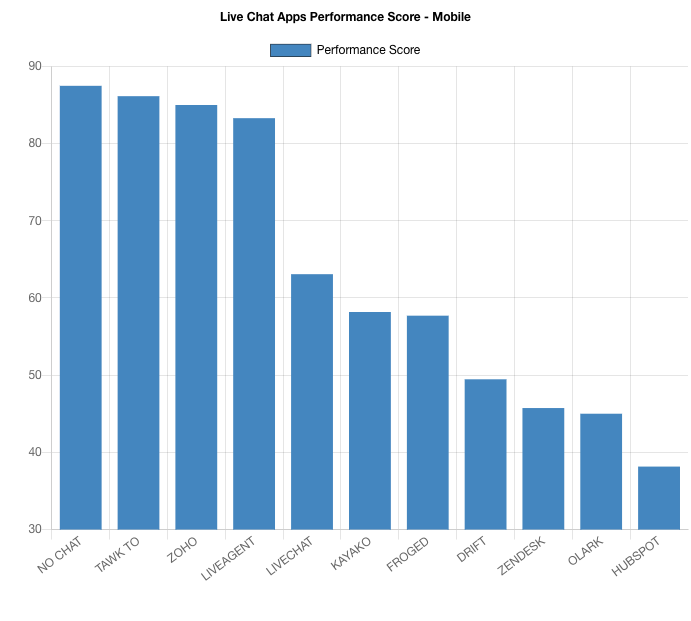
Which live chat app had the highest performance numbers on Mobile
On switching to mobile, the results were a lot more interesting. Tawk.to is still leading the pack with a score of 87 on average. It was the bottom half of the table that was surprising. Hubspot displayed a dismal score of 38 which is less than half of the Tawk.to’s score. Seems like Hubspot has some work to do to optimize its chat script for mobile.
Olark was consistently slow on desktop and now on mobile too. It could only manage an average score of 45 on mobile in our tests.
Even the very popular Zendesk was relatively slow with a score of 45.73 on mobile. Its desktop performance was acceptable but certainly not the most impressive one.
Core Web Vital Performance Of Live Chat Apps
Google is pushing the 4th gear with Core Web Vitals. It only makes sense that we factor in the impact these live chat scripts have on the Core Web Vitals of a website.
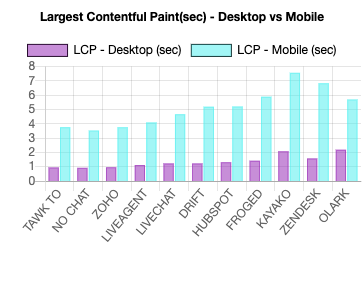
Largest Contentful Paint (LCP)
With the launch of Lighthouse v8.0, LCP has a weightage of 25% in the Performance category.
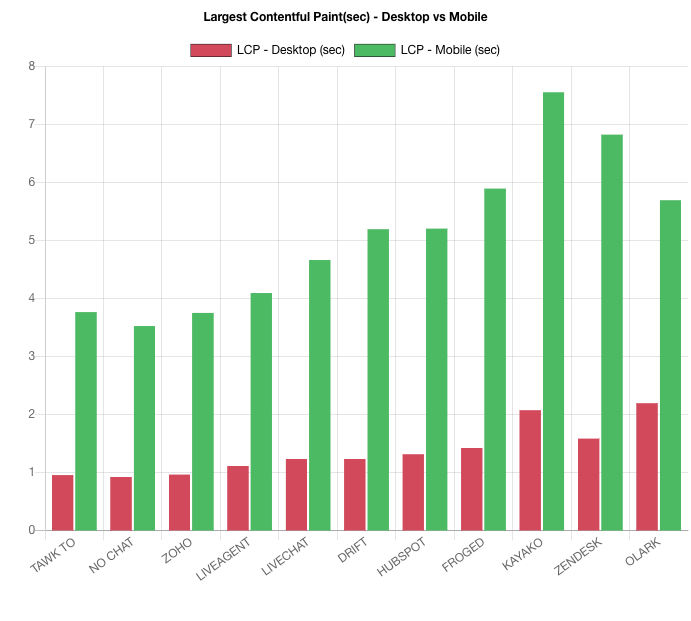
As you can see from the above graph, things have changed again. Tawk.to is still impressive. However, Kayako which was somewhere in the middle in our Performance numbers suddenly shows the maximum LCP spike.
As per Google’s recommendations, an LCP below 2.5 is good. Thus, all of the live chat apps pass the test on the Desktop. However, almost all of them fail when it comes to mobile but this is partly due to the already bad score of 3.5 sec as LCP mobile to start with. Nevertheless, while Tawk.to adds only an additional delay of 0.25 sec, Kayako adds ~4 sec to the LCP numbers.
If we break this down, we can easily conclude that even if the website had 0 sec of LCP, Kayako alone would have made the page load slow enough to be regarded as “bad” in Core Web Vital terms.

Total Blocking Time (TBT)
The second CWV is First Input Delay or FID. FID can only be measured with field or real-world data. Hence, in our tests, we chose to test Total Blocking Time. Google has claimed it correlates well with FID and thus should be used in lab results. Total Blocking Time now has the highest weightage of 30% in Lighthouse Performance metrics. Technically, it is now the most important metric that we should be paying attention to.
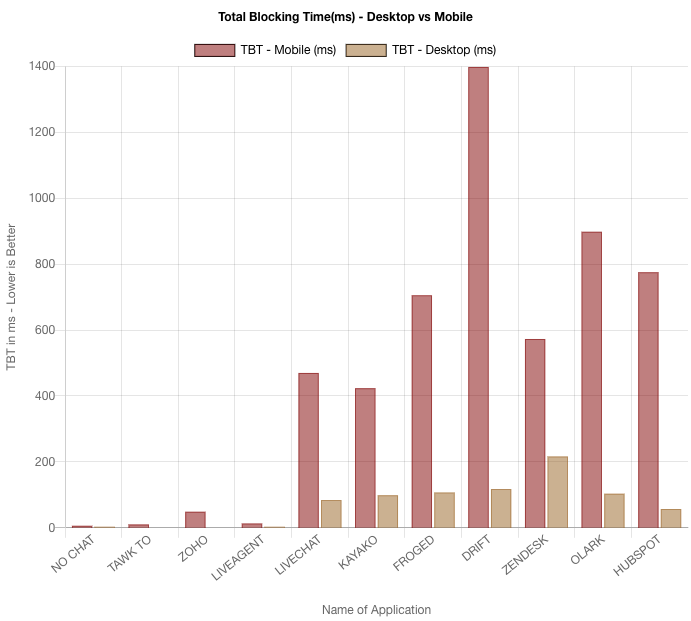
As per Google’s guidelines, a TBT below 300 milliseconds is preferred. As you can see, out of ten, seven live chat tools have a TBT beyond 300 ms. In fact, as per our test, Drift had an average TBT of almost 1400 ms. This is also the reason Drift gets ranked #7 with an average score of 49.45 under the Performance tab.
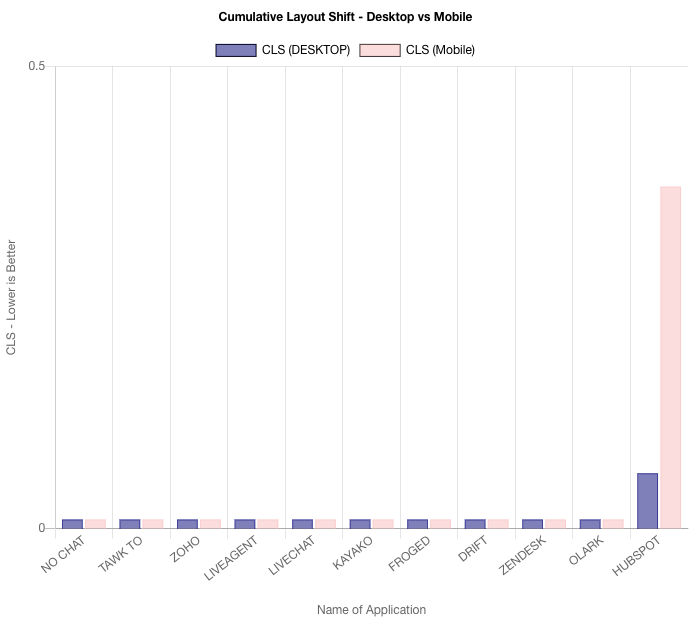
Cumulative Layout Shift
Cumulative Layout Shift or CLS is a troublesome metric and amounts to 15% in the Performance Scores.
As is evident from the data, most of the CLS scores are static. Olark does seem to spike up the CLS on mobile a bit but other than that, all tools seem to behave well when it comes to CLS.
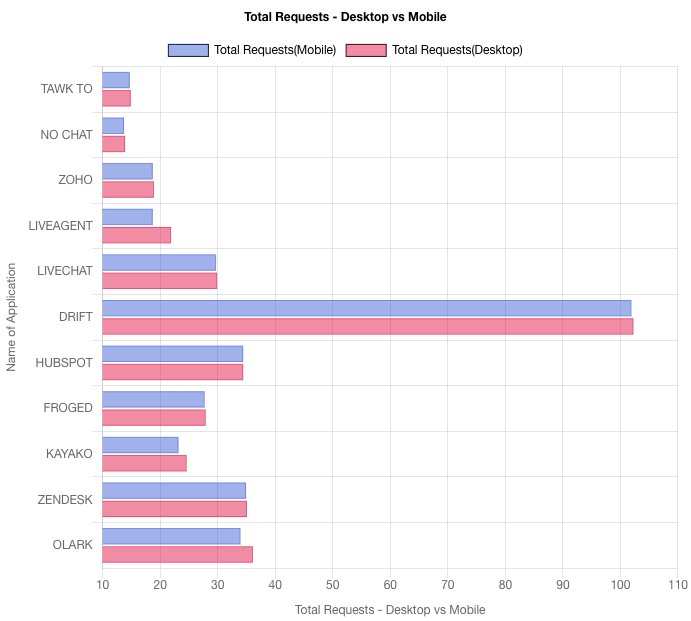
Total Requests
The number of requests needed to load a page is an important metric for improving web performance.
As we found out in our tests, pretty much all chat scripts add extra requests once integrated. While Tawk.to adds only 1 extra request on average to page load, Drift increased the total requests count to 100+. The default WordPress starter with no chat shows around 14 requests on average. That’s a rise of more than 600% in the number of requests.
Concerning!
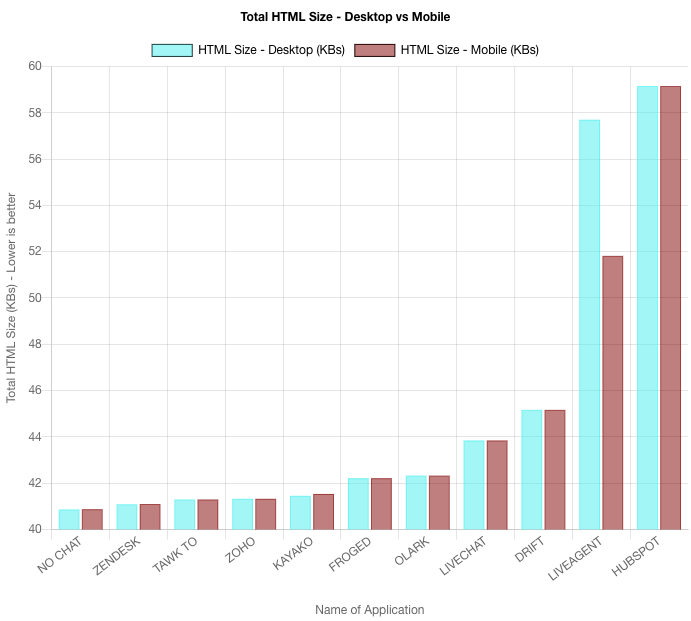
Total HTML Size
Almost every tool you run to test page speed will tell you about the HTML size and the total page size (discussed next). Each would suggest minifying the HTML by deleting those extra lines of code or comments.
In our tests, the average page size without any chat scripts integrated was around 40.87KB. While most scripts do not add too much to the HTML size, LiveAgent, and HubSpot seem to add ~15-20KB of additional HTML to the page. Because the data for Desktop and Mobile was the same, the chart represents only one platform.
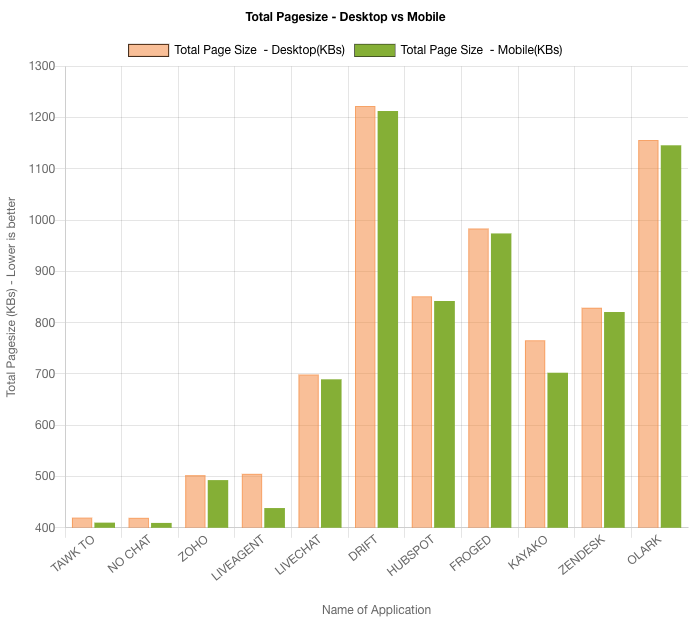
Total Page Size
Total page size includes HTML, CSS, Javascript, Font files, and more. Ideally, we need to keep this low. This includes minifying and compressing any files needed by the page.
The data surrounding it is very interesting. As per our tests, the average total size (without any chat scripts) was around 410-420 KB for the test website. The chat tools Froged, Zendesk, and HubSpot doubled the total page size whereas Drift increased the page size to 3X with an average of 1200 KB.
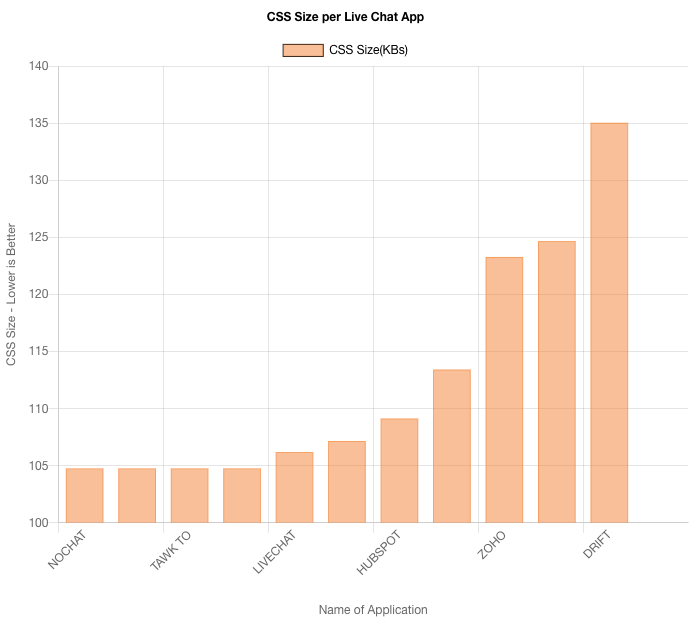
Total CSS Size
Scripts like live chat tools often add additional CSS files and javascript to the page load process. This can be evidently seen from the above page size data too.
In our CSS size test, we found tools like LiveAgent could add almost 50KB of additional CSS to the page. Drift only fared as second-worst with about 30 KB of additional CSS. Tawk.to and Zendesk were impressive with almost no changes in the average CSS size to the page load.
Total Javascript Size
Javascript is quite complex than normal HTML. The entire process of execution of javascript required for the page can add a substantial amount of time to page load process. As a rule of thumb, keep javascript files during the page load process to a minimum.
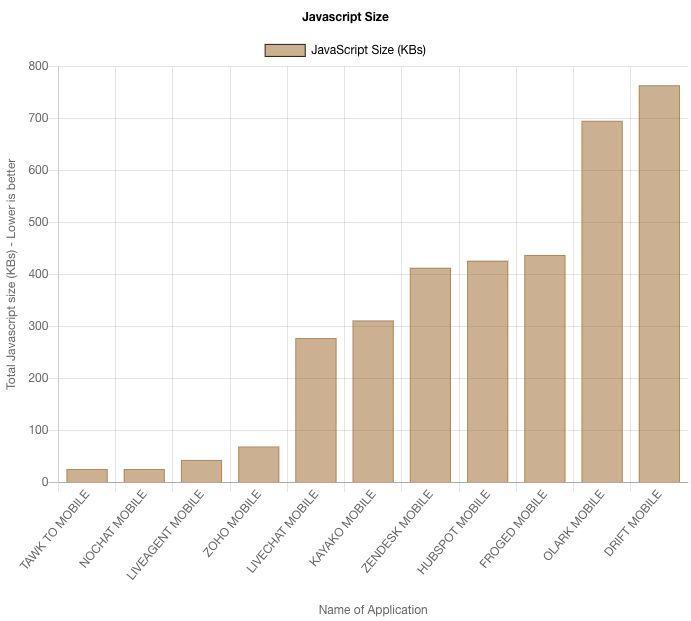
The site had 25 KB of javascript without any live chat script. Our test suggested how some of the live chat scripts brought tonnes of extra javascript to the page load thus increasing the overall page load time.
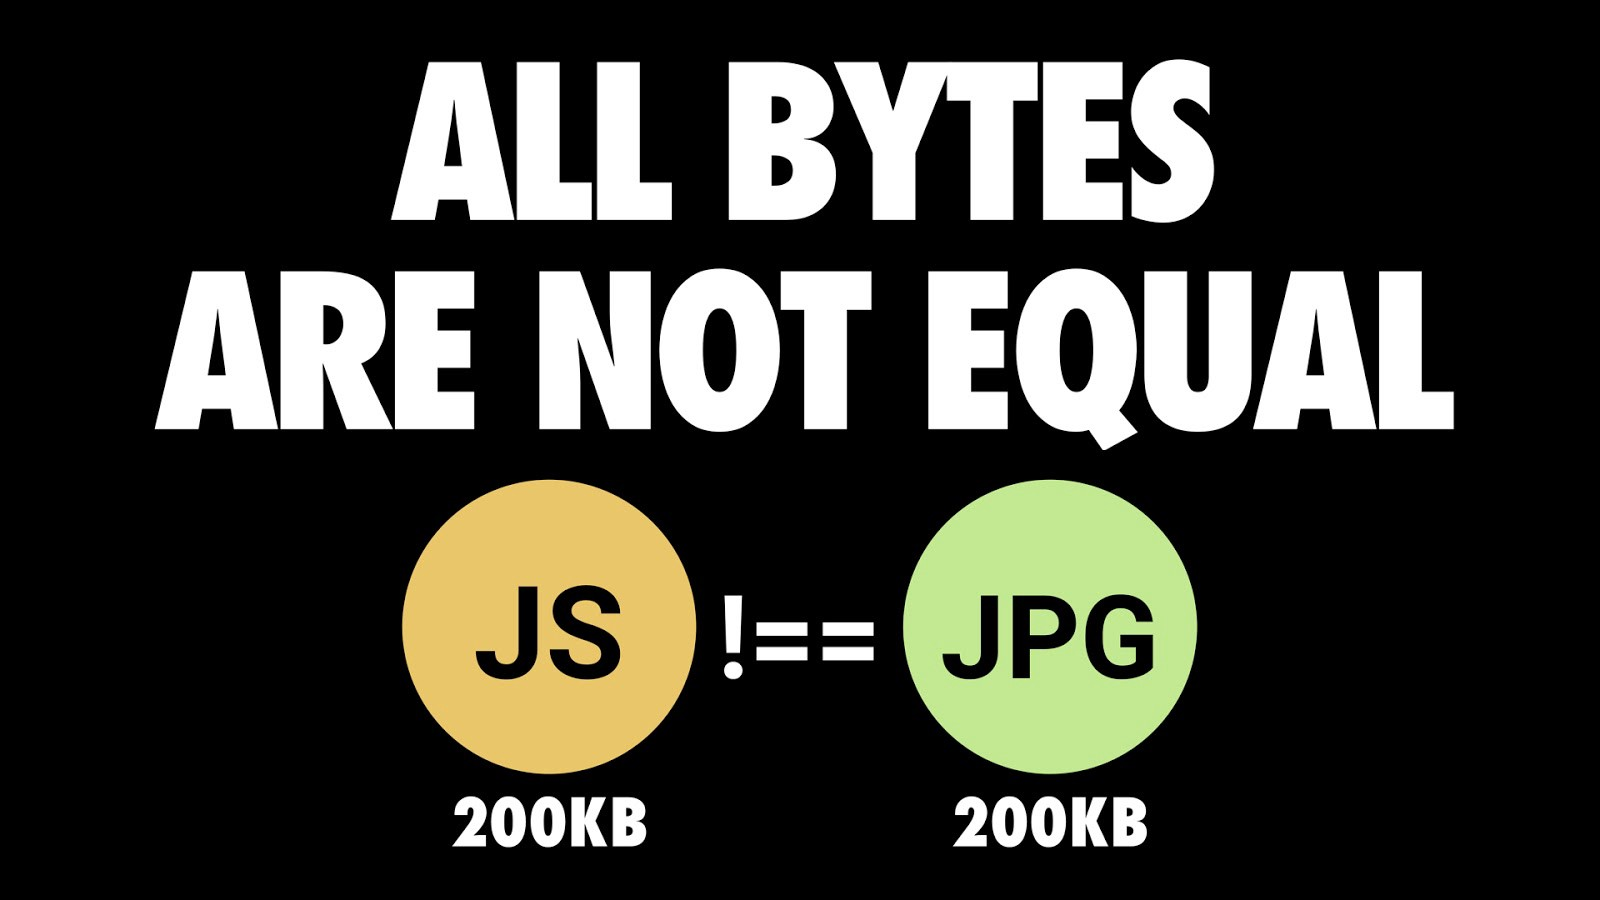
Our worst offender is Drift (yet again). On average, it added about 720KB of additional javascript code to the page load process. Surprisingly, this is almost twice the amount of code than the entire page size of the website (~410KB). As shared by Addy Osmani in his amazing Cost of Javascript 2018 article, a 200KB javascript is not the same as a 200KB image.
Drift is not the only one guilty. LiveChat, Kayako, Froged, Zendesk, HubSpot, and Olark all add a lot of Javascript code to the page load process on average.
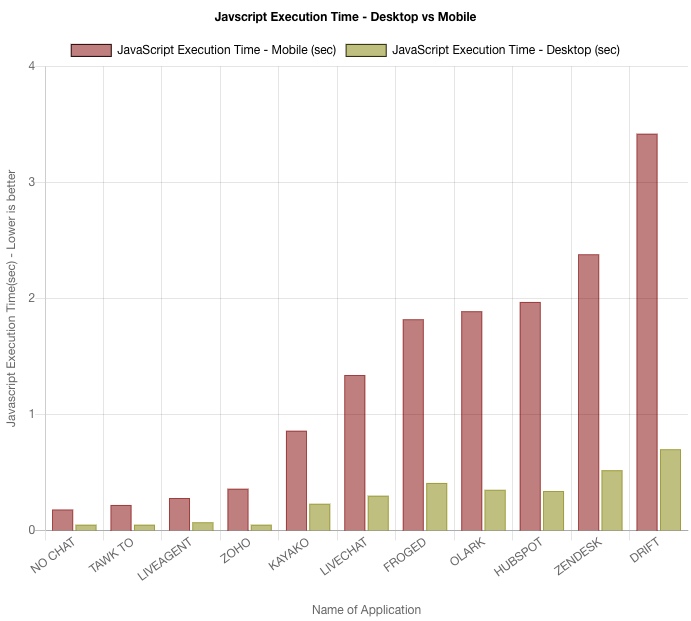
Javascript Execution Time
As evident in the section above, the Live chat scripts were adding javascript to the page. Here’s how the javascript execution time looked in our tests.
Drift takes the maximum amount of time for javascript execution which could be expected as it adds the maximum amount of javascript to the pages. What’s surprising is that Zendesk, which had a smaller amount of javascript code (412 KB on average) compared to Olark (695KB), took more time to execute the javascript.
Conclusion
The tests we performed were averaged to make it for a simplified representation of the data. In addition, we didn’t perform any optimizations to the site either. This means the scores can be improved slightly but then there’s only limited optimization possible with 3rd party scripts.
Impact on page load speed isn’t the most important factor when a site owner is considering a live chat tool. However, considering that most live chat tools now come with all the nitty-gritty features a live chat tool should have, most are on par with each other.
Considering this, the impact on page load speed might be an additional factor that you could use to select a preferred live chat partner.
For the people racking their brains regarding whether their website should have a live chat option or otherwise, the answer is simple. You can perform an A/B test and see what kind of impact a live chat has on conversions and whether the improvement in speed after removing chat is the same or better for conversions or not.
Another thing that can be done is testing a live chat alternative that offers improvement in speed but keeps all the primary features intact. For e.g Tawk.to was super fast as per our tests, so if it offers all the bells and whistles you need, you can consider switching to it.
We hope that you found this blog helpful.
In case you have any queries or are looking to improve your site’s speed, feel free to write to us at [email protected]. We’d love to speak with you
- About the Author
- Latest Posts
I am part of the CueForGood’s Organic Search(SEO) team. I love playing football and reading about Technical SEO.

Rajiv Singha
I am part of the CueForGood's Organic Search(SEO) team. I love playing football and reading about Technical SEO. LinkedIn
MORE POSTS-
Google AI Mode Explained: How It’s Reshaping Search and Content with Real Examples & Tips
by Tapam Jaswal
If you’re in SEO or content and have been watching Google’s changes, you already know: AI Mode isn’t a minor …
-
Jiva’s Organic Traffic Growth: 354% Surge in 6 Months | CueForGood
by Nida Danish
Summary: Jiva’s efforts to empower smallholder farmers weren’t gaining the digital traction they deserved. With a strategic overhaul led by …
Continue reading “Jiva’s Organic Traffic Growth: 354% Surge in 6 Months | CueForGood”
-
What We Learned When We Switched From Disposable Tissues to Reusable Napkins
by Nida Danish
At CueForGood (CFG), we’ve embraced a refreshing change: reusable cloth napkins. While the switch may seem minor, it’s rooted in …
Continue reading “What We Learned When We Switched From Disposable Tissues to Reusable Napkins”
-
Of Light, Laughter & Transformation: Diwali 2024 at Cue For Good
by Nida Danish
On any given day, walking into the Cue For Good office feels like stepping into a space with heart. It’s …
Continue reading “Of Light, Laughter & Transformation: Diwali 2024 at Cue For Good”
-
Why PHP Still Matters in 2024: A Look at Its Continued Relevance
by Girish Tiwari
At its peak in the early 2010s, PHP powered the majority of websites globally, including major platforms like Facebook and …
Continue reading “Why PHP Still Matters in 2024: A Look at Its Continued Relevance”
-
How Meta’s New Holiday Ad Features Can Transform Your Business This Season
by Charanjeev SinghThis year, Tapcart’s 2024 BFCM Consumer Trends Report suggests that nearly 60% of shoppers kick off their holiday shopping in …
Continue reading “How Meta’s New Holiday Ad Features Can Transform Your Business This Season”

2 Replies to “Is Live Chat Slowing Down Your Website?”